

 Toolbox Home
Toolbox Search
Statistical Charts – Toolbox
Download .ai File: 19_PSAT_Scores.ai
Added on 05/04/20
Comments 91
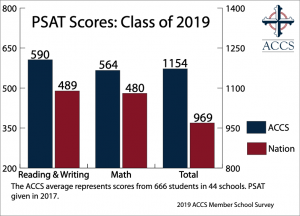
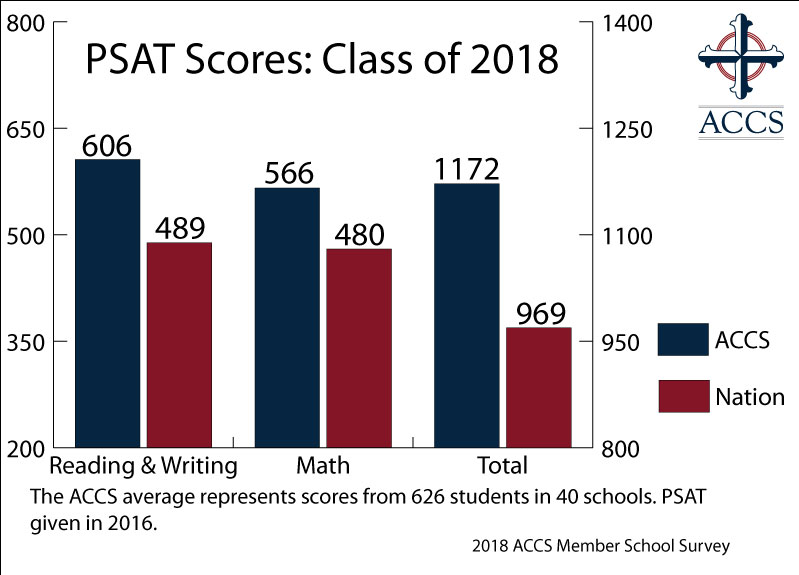
The ACCS average represents scores from 666 students in 44 schools. PSAT given in
Download .ai File: 19_SAT_Scores.ai
Added on 05/04/20
Comments 91
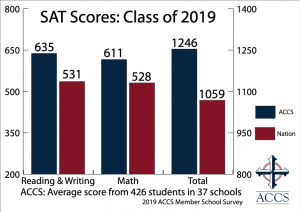
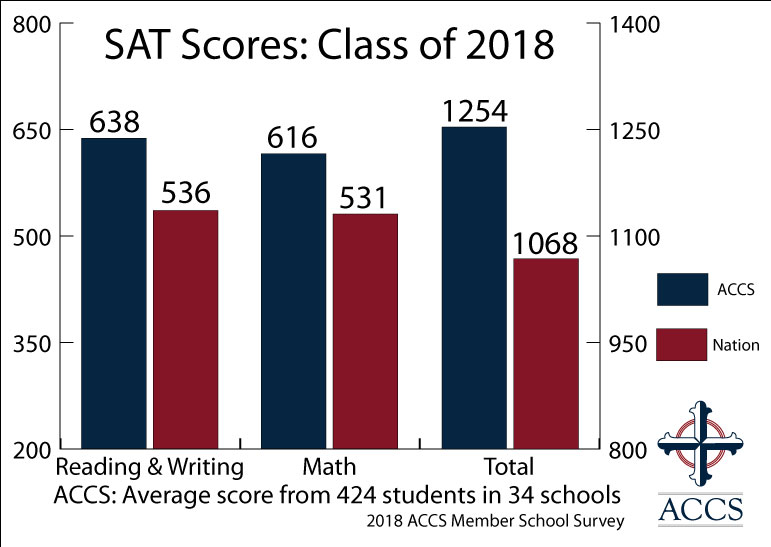
Average score from 426 students in 37
Added on 05/04/20
Comments 91
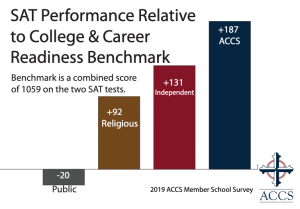
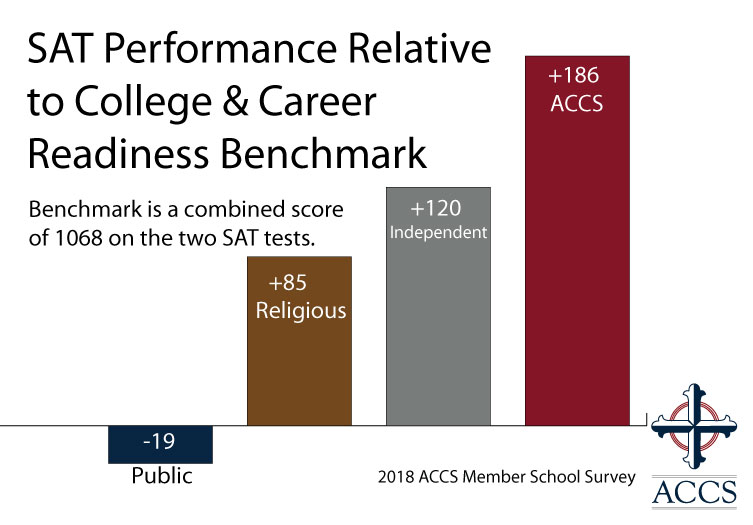
Benchmark is a combined score of 1059 on the two SAT
Added on 05/04/20
Comments 91
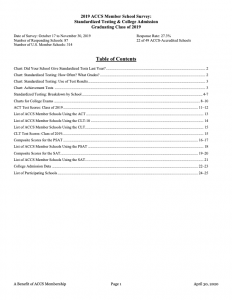
2019 ACCS Member School Survey: Standardized Testing and College Admission, Graduating Class of
Added on 05/04/20
Comments 91
Data is from the 2019 ACCS Member School Survey and the College
Download .ai File: 19_ACT_Scores.ai
Added on 05/04/20
Comments 91
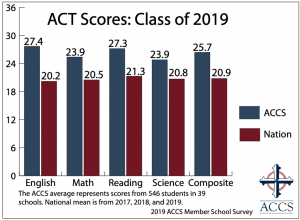
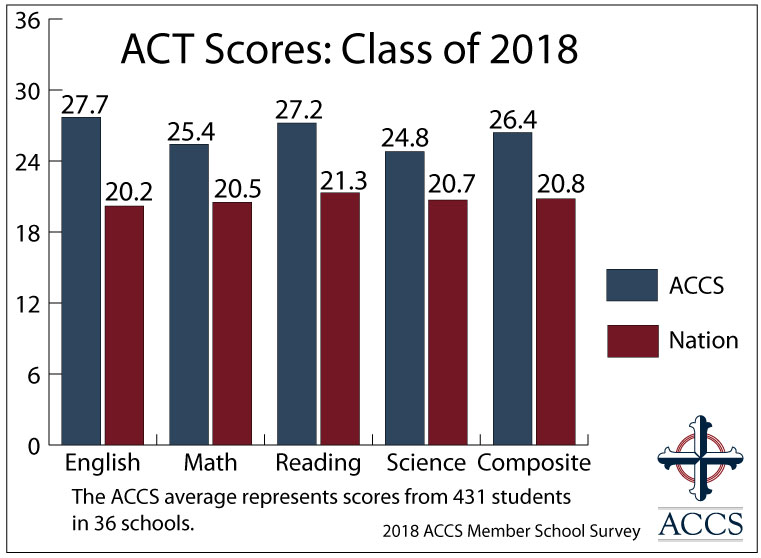
The ACCS average represents scores from 546 students in 39 schools. National mean is from 2017, 2018, and
Added on 12/10/19
Comments 91
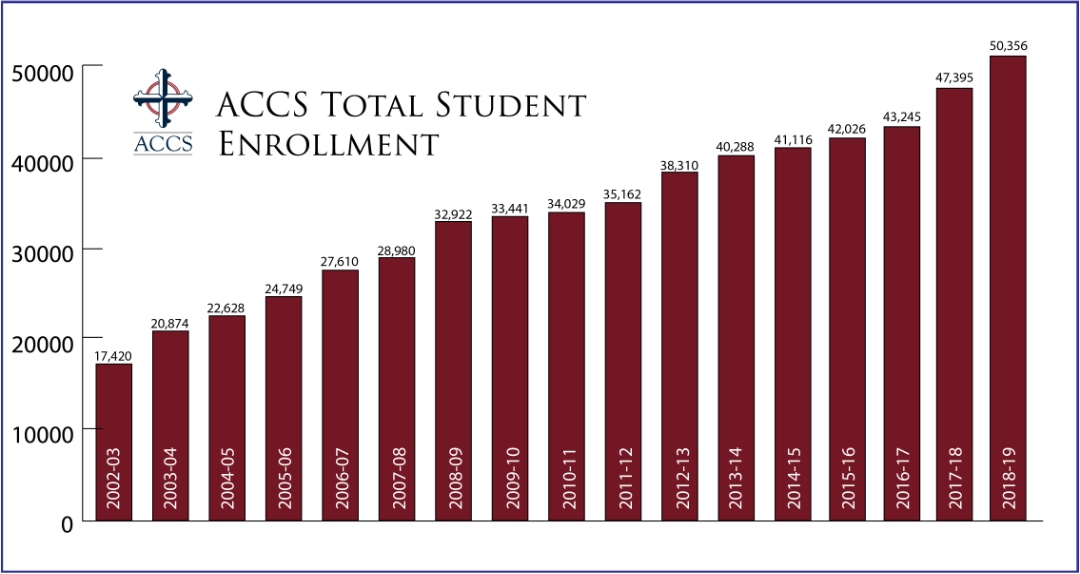
Latest ACCS student enrollment data.
Added on 12/10/19
Comments 91
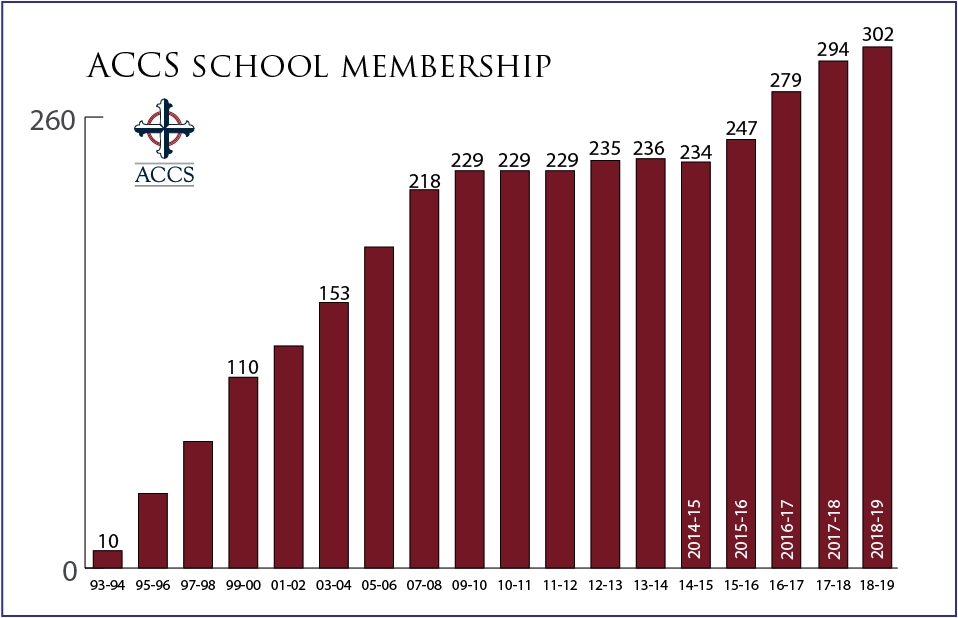
Latest ACCS school membership data.

Added on 05/07/19
Comments 91
2018 ACCS Member School Survey: Standardized Testing & College Admission, Graduating Class of 2018
Added on 05/07/19
Comments 91
SAT Performance Relative to College & Career Readiness Benchmark
Added on 05/07/19
Comments 91
ACT scores by subject: ACCS schools as compared to the national average.
Added on 05/07/19
Comments 91
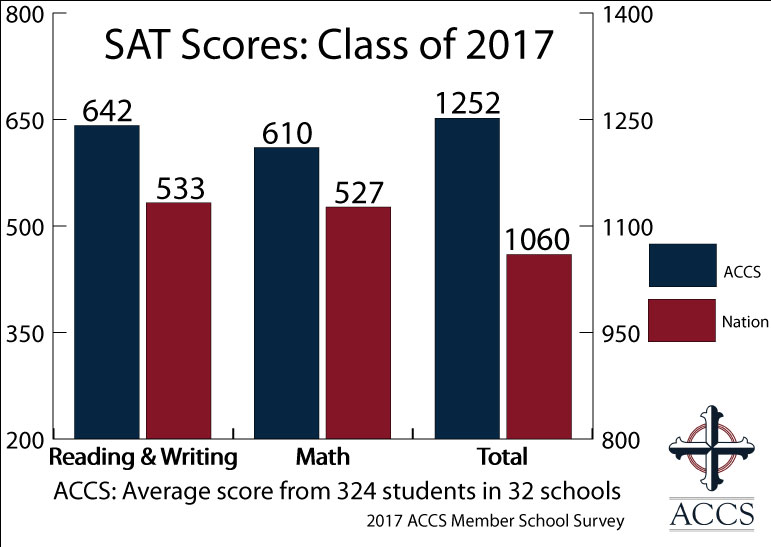
SAT scores by subject: ACCS schools as compared to the national average.
Added on 05/07/19
Comments 91
PSAT scores by subject for the class of 2018: ACCS schools as compared to the national average.
Added on 02/04/19
Comments 91
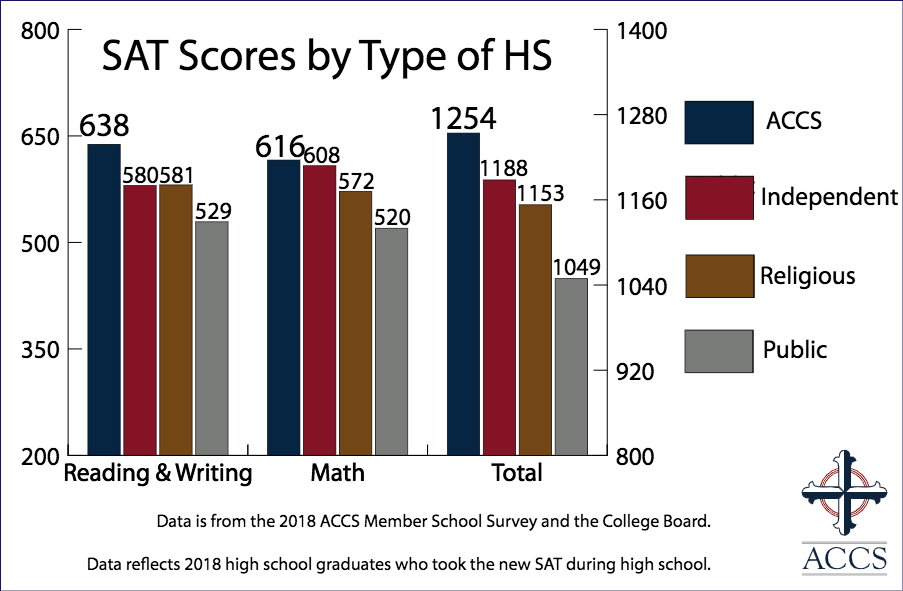
Scores on the SAT exam from the 2018 Standardized Testing survey by type of school
Added on 02/16/18
Comments 91
A report of ACCS schools conducted in the fall of 2017. This report provides data about the students graduating in the class of
Added on 02/16/18
Comments 91
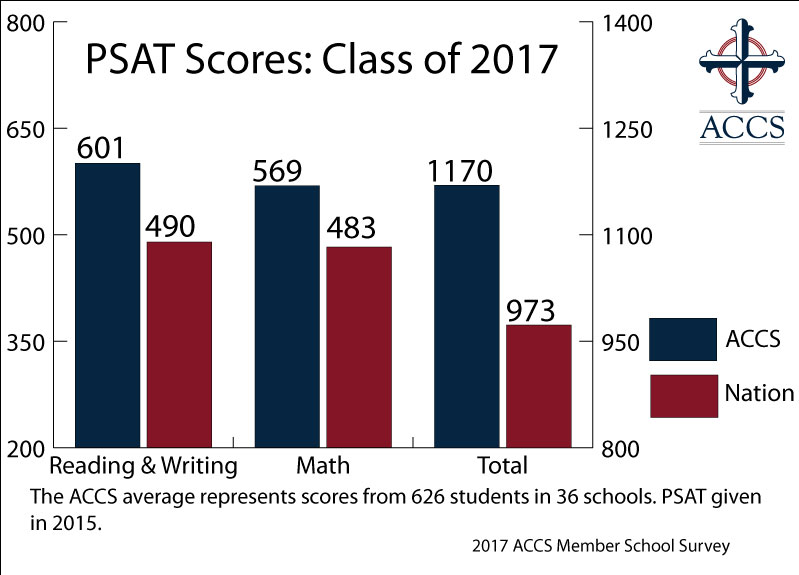
Scores on the PSAT exam from the 2017 Standardized Testing

Added on 02/16/18
Comments 91
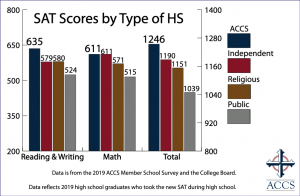
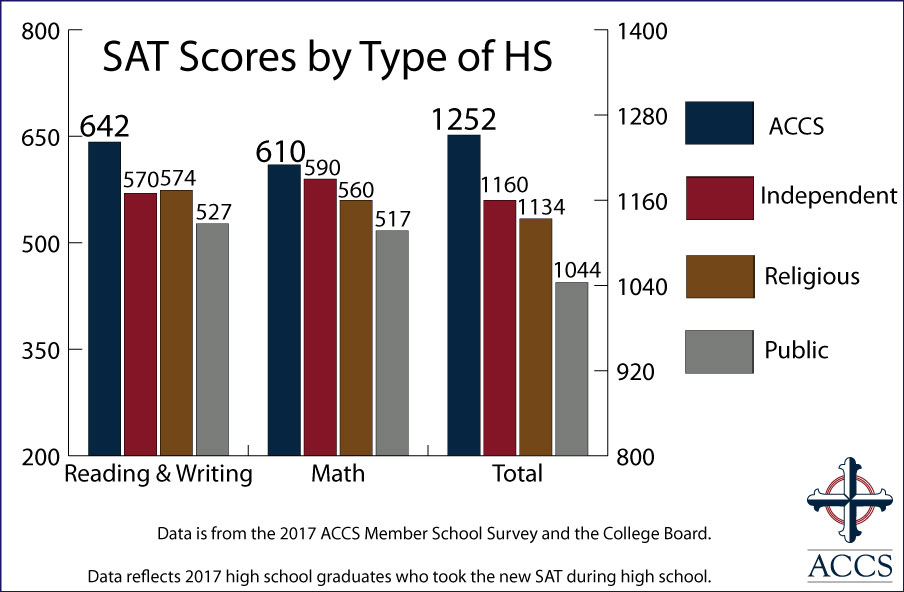
Scores on the new SAT exam for students graduating in the class of 2017. Scores are compared for graduates from ACCS, independent, religious, and public schools. Scores are shown relative to the
Added on 02/16/18
Comments 91
Scores on the new SAT exam from students graduating in the class of 2017. Scores are compared for students graduating from ACCS, independent, religious, and public high schools...
Added on 02/16/18
Comments 91
A chart showing scores on the new SAT from students graduating in the class of 2017. The chart compares scores from ACCS schools with national scores...

Added on 02/16/18
Comments 91
Scores on the ACT exam from students graduating in the class of 2017. Chart compares scores from graduates of ACCS schools with national norms. ...